Alisha DhillonTypical Requirements Gathering Questions in a Data Viz ProjectYou’re in charge of a project and have a kick-off meeting soon. Where do you begin? What will you ask? It is essential to have a…Feb 8, 20231Feb 8, 20231
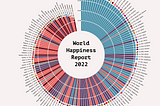
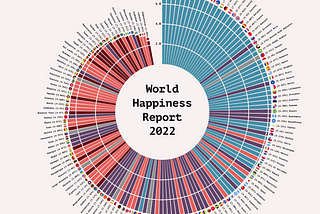
InTDS ArchivebyOscar LeoHow to Create a Polar Histogram With Python and MatplotlibCreating a graph that captures the eye and tells the beholder an insightful story.Aug 24, 20234Aug 24, 20234
InTowards AIbyBex T.3 Best (Often Better) Alternatives To HistogramsAvoid the most dangerous pitfall of histogramsSep 12, 202316Sep 12, 202316
InThe EconomistbyRosamund PearceWhy you sometimes need to break the rules in data vizBest practices help us to avoid common pitfalls in data visualisation — but we shouldn’t follow them blindlyFeb 28, 202012Feb 28, 202012
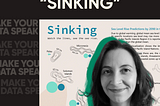
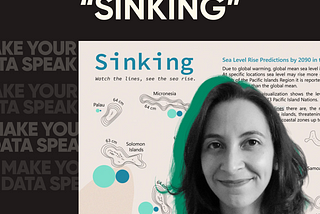
InMake Your Data SpeakbySilvia RomanelliBeyond Usual Charts: the Making of My Data Story “Sinking”My design process, from inspiration to research, data and visual choices.Jun 9, 20231Jun 9, 20231
InBootcampbyNg Wei JieWhat goes into a successful data visualisation?This semester, I took a module on data visualisation. After over 250 comments and nearly 100 files shared in class, here are my key…Dec 14, 2022Dec 14, 2022
InTDS ArchivebyAndy McDonaldVisualising Well Paths on 3D Line Plots with Plotly ExpressWorking With Plotly Express 3D Line PlotsJun 4, 20231Jun 4, 20231
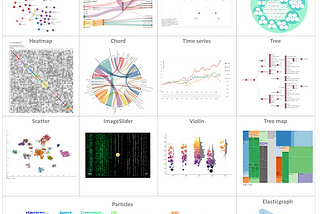
InTDS ArchivebyErdogan TaskesenD3Blocks: The Python Library to Create Interactive and Standalone D3js Charts.Create interactive, and stand-alone charts that are built on the graphics of d3 javascript (d3js) but configurable with Python.Sep 22, 202212Sep 22, 202212
InTDS ArchivebyEli HolderHow to: Visualize ‘Small Multiples’ Charts with Observable PlotMay 24, 2021May 24, 2021
InTDS ArchivebyDipanjan (DJ) SarkarA Comprehensive Guide to the Grammar of Graphics for Effective Visualization of Multi-dimensional…Learn effective strategies for leveraging a layered Grammar of Graphics framework for effective data visualizationSep 12, 20186Sep 12, 20186
Kristin HenryIn Defense of Pie Charts, and Why You Shouldn’t Use ThemIn the data visualization community, I’m probably best known for experimental projects…for data art, for particle systems inspired by…May 26, 20171May 26, 20171
InNightingalebyMichael FriendlyRaiders of the Lost Tombs: The Search for Some Heroes of the History of Data VisualizationMichael Friendly and Les Chevaliers des Albums de Statistique Graphique[1]Mar 23, 2020Mar 23, 2020
InBetter ProgrammingbyJeremy ColónAdventures in Plotly: HistogramsA deep dive into one of the most popular visualizations for EDAMar 9, 2023Mar 9, 2023
InUX and Front-End InterviewsbyOliver LindbergDesigning Beautiful Data Visualisations: An Interview with Shirley WuShirley Wu creates highly interactive data visualisations. Here she gives us a look behind the scenes and shares the lessons she’s learnedOct 20, 20222Oct 20, 20222
Evelina JudeikytėYour data storytelling profileRate your confidence in crafting, designing, and presenting data stories — and a chance to improve those skillsFeb 9, 20231Feb 9, 20231
InBootcampbyBrittany RosenauLink Hoarding: What Chart Should I use?15 bookmarks to help you choose your next chartFeb 16, 20231Feb 16, 20231
Kate StrachnyiData visualization rules that are meant to be brokenThere are several “rules” of data visualization that are commonly followed in order to create clear and effective visualizations. However…Jan 10, 2023Jan 10, 2023
InMedia HackbyAlastair OtterThe big list of data journalism tools and resourcesAll the data journalism tools and resources you need to get started — from newsletters and tutorials to mapping and visualisation tools.May 5, 2022May 5, 2022
InHCLTech-Starschema BlogbyIstvan KorompaiWhat’s a “Handmade Data Object” Anyway?See three dataviz experts tackle a challenge to ditch their computers and create a physical data visualization about life at work and…Sep 16, 2022Sep 16, 2022
Brittany RosenauLink Hoarding: Icons and ImagesEarlier I shared my collection of bookmarks I use for discovering and generating colors for data visualization projects. I’d like to share…Jul 23, 2022Jul 23, 2022